Tom Reis is president of Substructure Inc. Reis can be reached at [email protected] or 603.436.1039. Tom Waddington is senior scientist/chief hydrographer for Substructure Inc. Waddington can be reached at [email protected] or 603.436.1039.
Substructure Inc., Portsmouth, N.H., has completed a series of high-resolution multibeam and sub-bottom profile surveys of drinking water reservoirs commissioned by Pennichuck Water Works, Merrimack, N.H. In May 2011, Substructure conducted the hydrographic survey work on Bowers and Harris ponds in Nashua, N.H. The two ponds were created in the late 1800s by damming portions of Pennichuck Brook. The hydrographic surveys are being used to update engineering drawings and to provide an accurate assessment of available water storage capacities.
Equipment Aboard
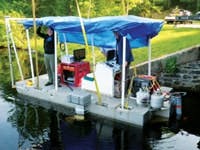
All of the multibeam and sub-bottom profiling survey operations were conducted aboard a portable survey barge—a stable marine platform configured to meet strict environmental standards for operations within a drinking water
storage impoundment.
The primary hardware components for the survey operations were an R2Sonic 2024 multibeam echosounder, an Applanix POSMV 320 vessel position and orientation system, and a Knudsen 3212 Chirp sub-bottom profiling system. A local GPS base station was established over a control point on Harris Dam to provide real-time kinematic differential GPS correctors to the survey barge.
Periodic water column speed-of-sound profiles were obtained using a YSI Castaway conductivity-temperature-depth (CTD) profiler, and continuous near-surface speed-of-sound values were obtained from a Valeport mini-CTD sensor mounted near the multibeam sonar array. Because of the water temperature differences between the surface and lower water column during the survey period, there were changes in the speed-of-sound profiles in both ponds. Frequent profiles and continuous monitoring of the near-surface speed of sound were required to monitor and account for refraction artifacts in the multibeam data.
Data Analysis
The initial steps in the multibeam editing process entailed a line-by-line review of the time series for all of the sensor data that was acquired or applied for each multibeam survey line (e.g., boat position, heading, heave, pitch and roll, water level, and speed of sound). After the raw sensor data was reviewed and edited, it was merged with the multibeam echosounder data to create an initial edited data file for each line that projected each beam in its true geographic position and elevation. These projected sounding files initially were reviewed and edited on a line-by-line basis, then within a broader area-based perspective in which the agreement between the extensive areas of overlapping data could be assessed.
After multiple iterations of the area-based editing process, gridded elevation surfaces were created based on an average of all of the valid elevations that fell within each grid cell. A 3-ft gridded surface was developed for the larger area that encompassed both ponds, and higher-resolution 1-ft gridded surfaces were created around the dam areas.
Following creation of the final gridded depth surfaces, a variety of modeled views of the data were created and exported as geo-referenced image files. This way they could be overlaid and viewed in conjunction with other complementary data products (e.g., elevation contours, high-resolution aerial imagery, prior survey data and shoreline GPS data). Various visualization products were created to depict the results of these surveys, enabling Pennichuck Water to more thoroughly evaluate and utilize the data.
Results from the multibeam data clearly depict the complex bathymetry within the ponds and reveal that the channel of the Pennichuck Brook remains a prominent feature throughout the length of both ponds (see graphics on page 59). Prior to this survey, it was thought that sedimentation had filled in much of the former meandering brook channel. This data, however, revealed that existing water flow must be sufficient to minimize the rate of sedimentation.
Using the 3-ft average gridded data, updated engineering drawings at various scales were created for both ponds. The 1-ft gridded data was used to create figures that provided a higher-resolution view of the existing conditions around the dam areas. Ultimately, the bathymetric data was merged with the shoreline topographic data to create a detailed elevation point file that was used to generate accurate and comprehensive stage vs. cumulative storage results.
“The high-resolution multibeam surveys provided us by Substructure give a highly detailed view of below-water topography that will enable us to make more informed water management decisions moving forward,” said John Boisvert, chief engineer for Pennichuck Water Works. “These data enable us to accurately update our existing engineering drawings and storage capacity estimates, and to better plan for future enhancements and water quality monitoring needs at both ponds. Most of our previous depth information for these ponds was based on the original topographic surveys prior to inundation around 1895.”
Download: Here


